
Speed up the planning process and build a solid business case with Comsof Heat, an automated planning and design tool for district heating networks.
Companies and communities are joining forces in the transition towards a sustainable energy supply, and district heating systems are gaining steam. To support this evolution, Comsof, based in Belgium, has introduced Comsof Heat: GIS-based automated planning and design software for district heating networks. This tool makes it easy to build a solid business case and speed up the planning process.
District heating network deployment projects are inherently disruptive to the local population: streets must be excavated and hot water pipelines installed underground to distribute the heat. The combination of extensive construction and the concomittent public agitation is very expensive in every sense of the word. Planning and design of these networks is a complex and time consuming process. Particularly during the feasibility study phase when comparing and contrasting multiple designs based on different assumptions would be ideal. Comsof Heat is speeding up this process by making use of intelligent algorithms for automated clustering of district heating connection points and automated routing of the district heating network in a GIS (Geographical Information System) application. The network pipe system is dimensioned with the software, the results are presented on a map of the district and a comprehensive overview of all pipe system lengths and network deployment costs is provided in a bill of material in Excel.
How does Comsof Heat work?
Comsof Heat has been developed as a plug-in for GIS tools, with QGIS as the default application. To start a project the GIS data of the district is required including at minimum the street center lines and building locations and heat demand per building.
The technical parameters such as temperature settings, pressure levels, pipe parameters and the cost of each network component can be modified using a configuration manager. The tool includes pipe specifications for the most common vendors divided by transport and distribution, allowing you to choose the specific type that you plan to use for your network deployment. Other vendors specifications can easily be added by the user.
Comsof Heat will automatically create a network topology which will connect each building to the network. Comsof Heat will divide the area into clusters, each supplied by a substation of a given power. Subsequently, the transport network will connect the source with the different substations. Streets and areas may be tagged with a reference cost. The automatic routing will avoid expensive streets and favour cheaper streets as much as possible. Furthermore, it is possible to classify the street cost based on the density of existing underground utilities. When maps with this information are available, the software can scan these files and create multiple categories with a different reference cost. The individual price per meter of the different types of pipe systems will be adjusted with the reference cost to come to an estimate with sufficient accuracy for a feasibility study.

Figure 1 – Comsof Heat: design methodology
Comsof Heat has been developed on the foundations of Comsof Fiber, the solution for GIS-based automated planning and design of optical fiber networks (FTTx). The routing and clustering algorithms are based on more than 10 years of development and have been adapted for Comsof Heat. These algorithms are highly scaleable and areas with thousands of connections can be calculated within a reasonable amount of time. Comsof itself is a global leader for FFTx planning software with customers in more than 70 countries and with more than 100 million FTTx connections planned since 2011. See figure 1.
Comsof Heat can dimension the transport network from the source to different substations, as well as the distribution network behind those substations in a single pass. Each network layer can be designed with different pressure levels, different temperature settings, and different pressure or flow velocity constraints. Optimal pipe diameter will be selected, and pressure and heat losses will be calculated.
Comsof Heat dimensions pipes for peak scenarios and diversity, and takes diversity requirements into account. The diversity calculation starts at the individual dwelling level, and is then calculated at every node in the network up to the substation. For customers with empirical data from other networks in the same region, custom diversity tables can be used in the dimensioning process. The output is very comprehensive and includes network topology, substation location, pipe diameter, pressure loss, heat loss, and flow velocity on every segment, … In addition, a bill of materials is generated with an overview of the trench length required for each pipe type, along with the associated cost for the deployment of the network.
Use of Comsof Heat results in a drastic reduction of the DH network design time, and is scalable to very large networks. The speed of the calculation gives the user of the software the option to consider multiple scenarios in a relatively short time, compare the scenarios, and select the most interesting. This has traditionally not been possible due to the effort involved in creating and dimensioning such a network.
Comsof Heat further includes a module for investment analysis which allows the user to calculate the net present value and other financial indicators related to your project over a period up to 40 years. The roll-out of the network can be evenly spread over a few years time where you can model an amount of network connections or an amount of network trench kilometers to be added on a yearly basis. For a more detailed approach, you can select multiple regions on the map by drawing polygons and indicating in which order, year by year, these zones will be deployed. Different roll-out scenarios can be evaluated and compared.
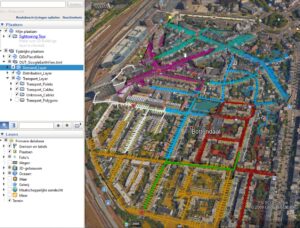
Figure 2 – KML export and visualisation in Google Earth
A KML file is generated for visualisation in Google Earth. This can reduce the need for site surveys in the feasibility phase of the project and further speed up design delivery. See figure 2.
Who is using Comsof Heat?
Our customers are the foundation of our success, they include: utility network operators, owners of (excess) heat source plants, engineering & consulting firms, district heating equipment manufacturers as well as local authorities. We are also cooperating with universities and research centers in Belgium who are using our tool in their research and provide us with valuable input to prepare for the next generation of networks.
An interesting case was the Rotterdam Engineering’s feasibility study of district heating network with energy from a geothermal source. A utility company provided a list of 14000 potential customers and the goal of the project was to determine the most interesting areas from an economical point of view as input for a master plan.
“For a large study like this, we needed an automated solution.”, says Pieter-Jan Dewitte, DHC engineer at Rotterdam Engineering.
Pieter-Jan: “The principal added value of the software is that it’s very strong graphically. The software allows you to see the whole network, with all its components and possible users, in a GIS application and Google Earth or Google Street View. This is comfortable for us, and has a huge added value for the client, as it makes the whole network much easier to visualize.”
“Secondly, I value the software’s flexibility. If a rule needs changing, we can implement this fairly easy. For example, we decided to only connect buildings with a fixed minimal yearly energy consumption. After we selected these buildings, the software automatically changes the network topology and the diameters of the pipes. With other solutions you would have to start over. So, this makes it easy to try several scenarios and allows you to experiment with different parameters. To eventually come up with the optimal solution.”
“With Comsof Heat we can handle larger projects”, concludes Pieter-Jan. “For a case as big as this, we would have needed three months, which would’ve been too long. Now we did the calculations in a few days, and with more detail.”
Case study: city of Ghent, Belgium
With a theoretical feasibility study for the city of Ghent we will illustrate a possible use case of Comsof Heat. The city of Ghent is the second largest city in Flanders with more than 250000 inhabitants. There is a port in the north of the city with industrial activities and availability of excess heat. The primary goal is to identify the most interesting clusters based on linear heat density and create a network design for those clusters including an initial cost estimation.
For the study we assumed that we have the availability of a peak power of 40MW. The heat will be transported via a network from the port area to the city.
In this sample case we based the yearly heat demand per building on the average yearly gas consumption per household (publicly available information from the Belgian regulator). The yearly consumption is then adjusted proportionate to the ground surface of the building. To derive the peak heat demand from the yearly consumption we also assume an uptime of 1000 hours per year. A more detailed approach could be used, taking into account year of construction, level of insulation, building function, etc.. This would lead to a more accurate estimation of the heat demand but is not in scope of this study.
We chose to create a transport network with a max pressure of 25 bar (PN25), a supply temperature of 120°C and a return temperature of 70°C. The distribution network will be designed for 10 bar (PN10), a supply temperature of 90°C and a return temperature of 60°C. We chose to use substations of max 2500kW.
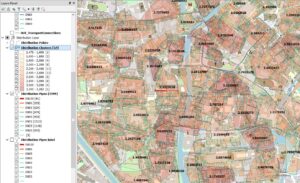
Figure 3 – Case study: phase 2 – results
In a first step we consider the dense urban, urban and suburban areas of the city with more than 36000 dwellings. A number of suburban districts are manually excluded in order to focus mostly on the dense urban and urban areas. This step reduces the number of dwellings in the area under consideration to approximately 26000. Next, we apply a random selection of 70% of the dwellings to simulate the initial adoption ratio. This further reduces the number of dwellings to approx 18000. The investigation of additional scenarios, with different adoption ratios is not part of the scope of this study.
Generating a design with these inputs results in a network of more than 200 clusters of 2.5MW and a peak power requirement (after applying diversity) of 450MW. This large network exceeds the available peak power of 40MW.
In a second step we further reduce the area and exclude the areas outside the inner city and focus on the dense urban areas. Keeping the total surface smaller reduces the cost of the transport network. This decreases the number of dwellings to approx 2500. A second design results in a network with 57 clusters. About half of the clusters have a peak power demand of 2.5MW, while the rest have lower peak demand. The total peak power required for this design is with 89MW, still more than double what is available at the source. See Figure 3
Each of those clusters has an attribute indicating the linear heat density. We use this indicator and consider an LHD treshold of min 2.5 MWh per m per annum and exclude the clusters with a lower linear heat density for further analysis.
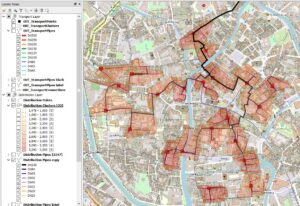
Figure 4 – Case study: phase 3 – final design
In a third step we consider a possible roll out scenario and start selecting a number of clusters with a high LHD close to the source. The number of clusters is increased step by step via manual selection. For each step, a network topology is generated and the total power demand is verified. Additonal clusters can be added until a peak power of approx 40MW is achieved. Each new design can be generated in about 10 minutes. See Figure 4
The network has a total trench length of 34km, of which 28km is for distribution and service connection pipe lines, and 6 km is for transport network. There are 22 substations required, of which 15 require 2.5MW of peak power, and 7 have lower peak demand as low as 1.2MW. See Figure 5
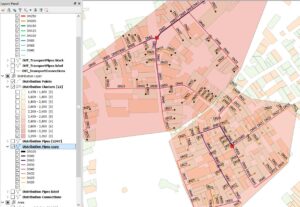
Figure 5 – Case study: phase 3 – final design detail
This can be considered an initial, high level design. Additional scenarios can be generated in a matter of hours. As such the tool provides an integrated solution for automated district heating network planning, delivers detailed results, handles large areas, and allows the generation of more, solid, business cases for your project with huge time savings.
Author: Kurt Marlein is Head of Innovation at Comsof. After a career of 15 years in the mobile – and satellite communications industry he joined Comsof in 2017. Comsof is providing GIS based planning software for utility networks and he is responsible for the innovation projects. He is also leading product management of products in the energy sector (district energy networks, power distribution networks and smart grid communication networks).
Contact information: [email protected], Tel +32 9 275 31 00, www.comsof.com